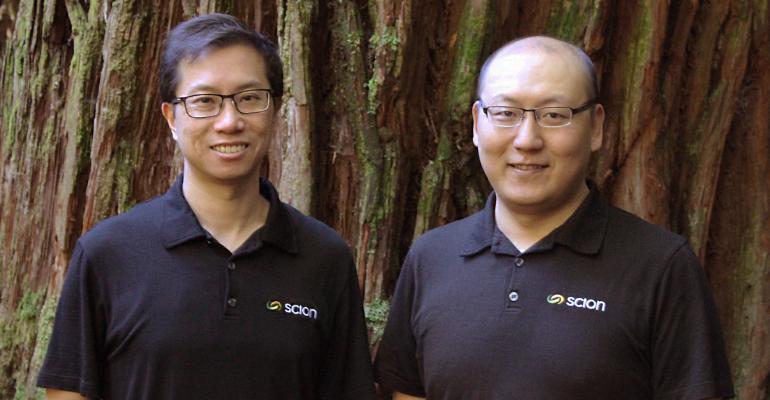
Dr Alan Yu Shyang Tan
Speaking for the trees
Over 10 years of data, you might think the key to a successful forestry plantation is rainfall, but what if the data is examined over 100 years?
What other factors could grow in prominence over time? Could soil quality, sunlight, planting density or exposure to wind be even more important?
SfTI researcher and Scion data scientist, Alan Tan and his team are designing a system that derives helpful information from over 100 different measures of forest health from tens of thousands of plots distributed around New Zealand, and which extend back through the past century. The measures include height, diameter of stems, rainfall and the type of forest management in use.
Alan’s system uses a computational ‘recommender’ to analyse the huge amounts of data and make suggestions about patterns that could be of most interest to help forestry economically.
“It’s a hugely complex database across both time and the vast number of locations,” Alan says.
“We’ve been able to help researchers at Scion work with and analyse the data faster and easier, and the system is showing promise. We’re generating a better and deeper understanding of the dataset.”
Although the dataset has been used before in various studies that attempt to answer specific questions about forestry, Alan’s challenge has been to make use of it over long periods of time, which is extremely complex, even with the aid of computers.
His approach has been to move away from the traditional ‘depth-first’ analysis, which drills down into variables to find answers to specific questions, toward a more general ‘breadth-first’ analysis, in which the computer looks for all possible data relationships, organises them, and then recommends them to the user, starting from those of the most interest.

Once the visual recommender system has sifted through the data to rank the combinations and correlations that seem most meaningful, it then displays them visually using graphs, charts and other graphic imagery to help the scientist better understand their significance.
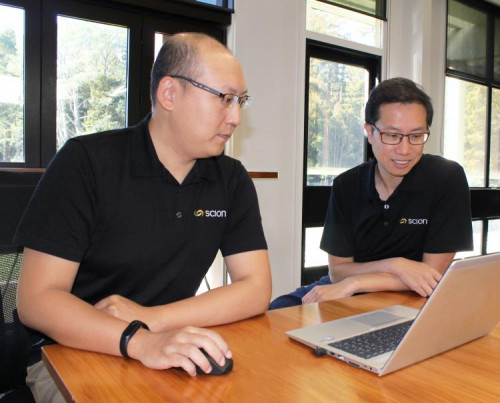
“We can show someone the top ten most interesting plots, and then let them view how those change over time by moving a slider forward and backward through time. It really allows the scientist to interact with the data.”
“It really allows the scientist to interact with the data.”
While the science is being developed with the forestry dataset in mind, Alan says the visual recommender software the team are developing could also be applied to other complex spatiotemporal datasets, in which there is a high number of variables. These could be rapidly analysed over shorter periods, or even in real time to give useful predictions.
“This could be really helpful to those needing urgent answers, such as for flu outbreaks over many geographic locations, and other potential applications like understanding climate patterns,” Alan says.
The team has completed two user studies to assess how effective, easy to use and relevant the results delivered by the software can be.
“We’ve established a useful foundation and are moving in the right direction. The next thing is to make it more powerful and more flexible.”
The team will be publishing their results soon. Follow @sftichallenge on Twitter to stay informed.